Monitoring
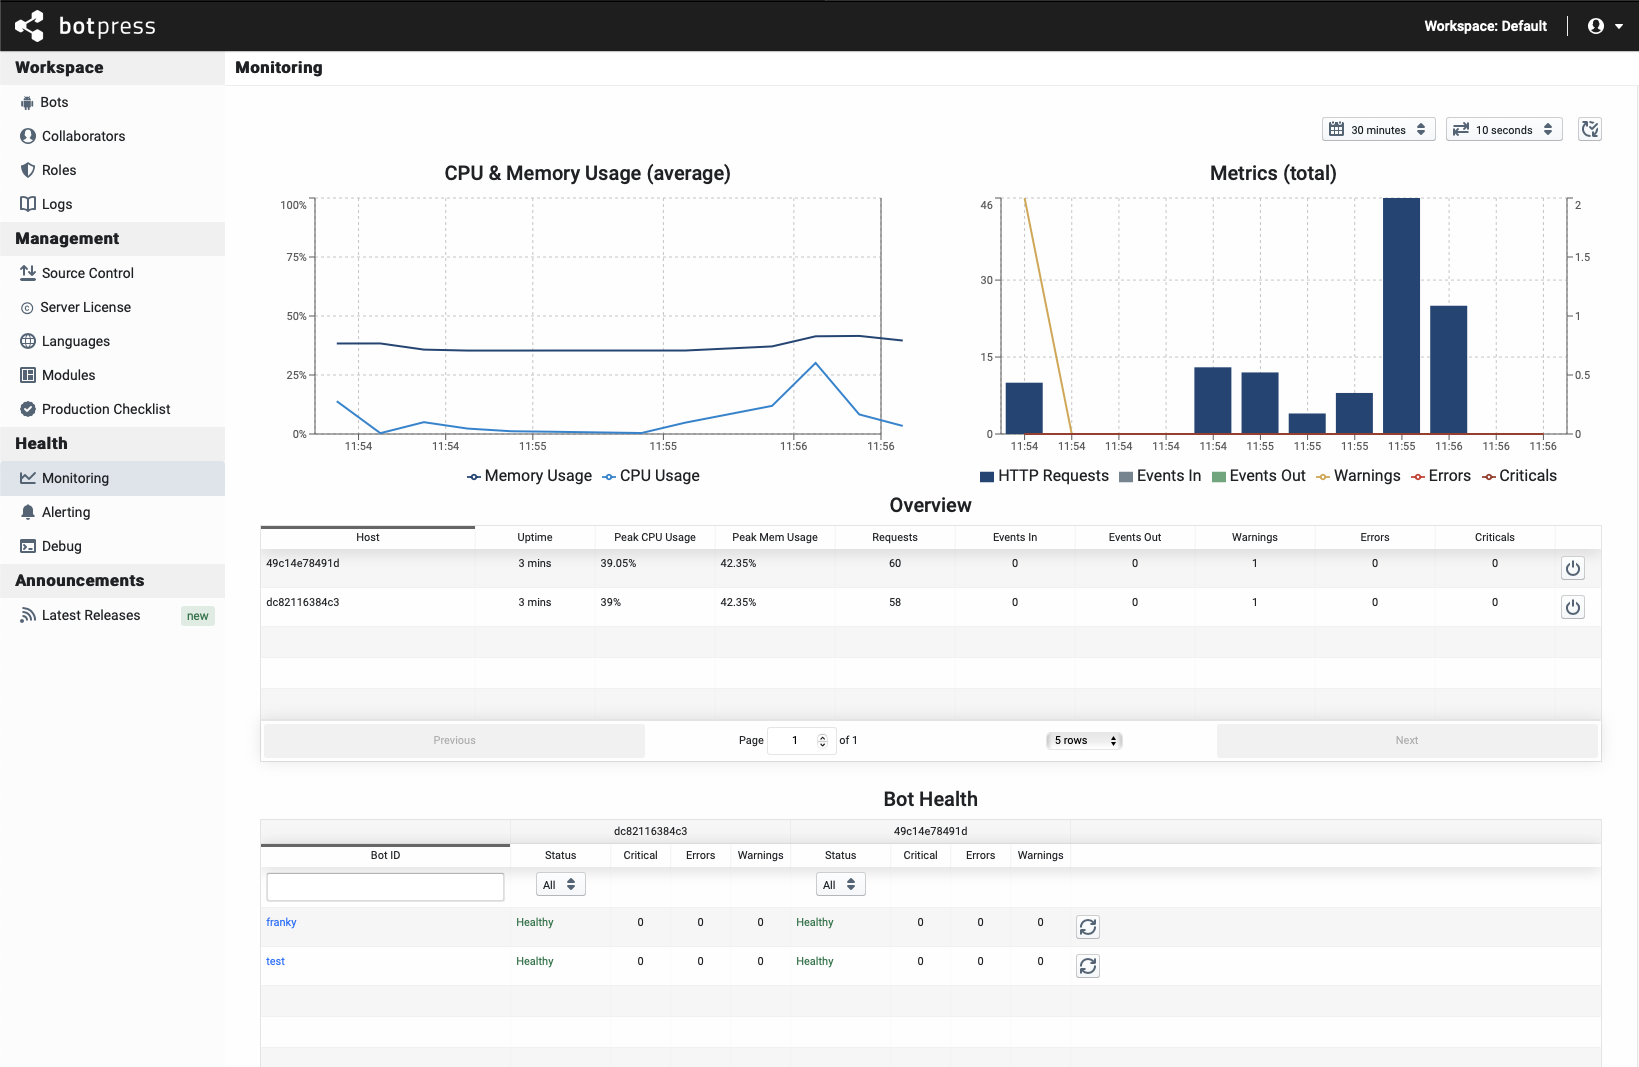
Monitoring is an essential part of any software deployment. Botpress includes, out of the box, a simple but intuitive dashboard designed to keep an eye on your servers. Key metrics are collected (like CPU and Memory usage), including a couple of botpress-related metrics.
Metric data is collected and stored using a Redis server.
This feature is only available to users of the Pro version.
Prerequisite
- Botpress Pro must be enabled with a valid license key;
- Redis Server must be running (minimum: version 2.8).
Quick Start
- Open your
botpress.config.jsonfile and setpro.monitoring.enabledtotrue. - Set an environment variable named
CLUSTER_ENABLEDtotrue. - Set another environment variable named
REDIS_URLwhich should point to your server (example provided below). - Start your Botpress Server.
Configuration
The default values should be good for most situations. They are described in details directly in the Botpress Config Definition
Redis Configuration
The environment variable REDIS_URL must be constructed like this: redis://user:pass@hostname:port
If you start it locally, this should do the trick: REDIS_URL=redis://localhost:6379
Metrics
These metrics are collected for every node of your Botpress Cluster.
- Average % of CPU usage
- Average % of Memory usage
- Number of HTTP requests processed
- Number of incoming events (when users sends messages to the bot)
- Number of outgoing events (anything the bot sends back to users)
- Number of warnings
- Number of errors
- Latency of HTTP requests